
Walmart (WMT) · Fiscal Q3 2027 · Form 8-K filed Nov 19, 2026
Shares: -1.0% in premarket trading (as of 8:37 AM ET)
| Key figure | This quarter |
|---|---|
| Revenue | $188.84 billion |
| Net income (GAAP) | $4.95 billion |
| Diluted EPS (non-GAAP) | $0.65 |
Results
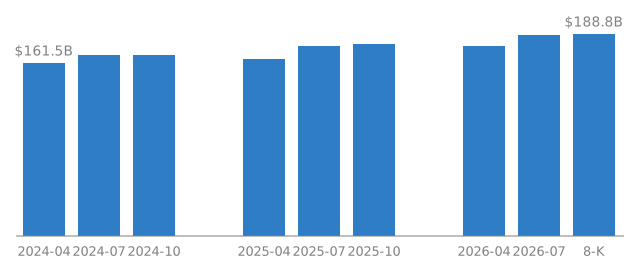
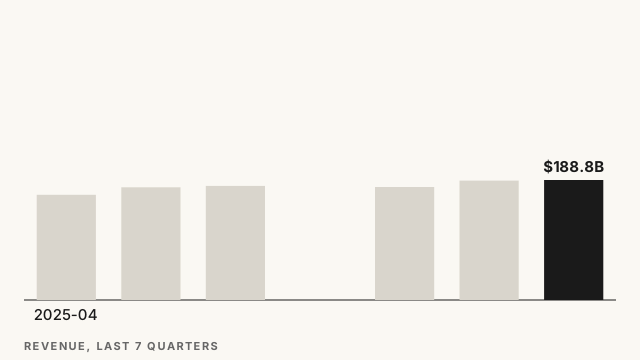
Revenue was $188.8 billion, up from $179.5 billion a year earlier. Sales grew, but profit moved the other way.
Net income attributable to Walmart was $4.9 billion, down from $6.1 billion in the same quarter last year. That is a drop of 19.5%, as the company reported it.
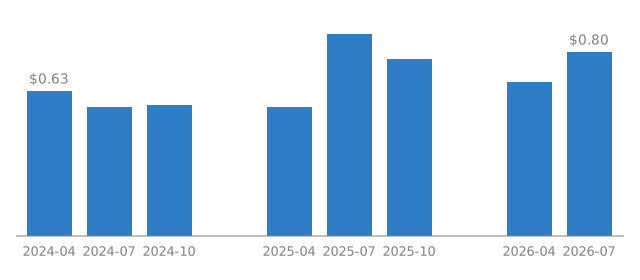
Adjusted diluted EPS was $0.65. The company said GAAP EPS was $0.62. Adjusted EPS leaves out a net loss of $0.03 per share on equity and other investments.
Shares were down 1.0% in premarket trading after the report.
Guidance
Walmart raised its outlook for fiscal 2027.
- Net sales are expected to grow 4.9% to 5.2% in constant currency.
- Adjusted operating income is expected to grow 8.0% to 8.6% in constant currency.
- Adjusted EPS is expected to be $2.84 to $2.89.
What else stood out
- Global eCommerce sales grew 17%, led by store-fulfilled pickup and delivery.
- The global advertising business grew 25%.
- Walmart issued $6.5 billion in long-term debt at favorable rates for general corporate purposes.
Revenue has trended up across recent quarters. It was $177.8 billion in the quarter ended April 2026 and $187.9 billion in the quarter ended July 2026. GAAP diluted EPS in those two quarters was $0.67 and $0.80.