
McDonald's (MCD) · Fiscal Q3 2026 · Form 8-K filed Nov 4, 2026
| Key figure | This quarter |
|---|---|
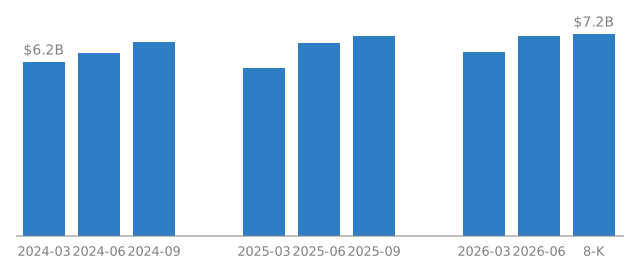
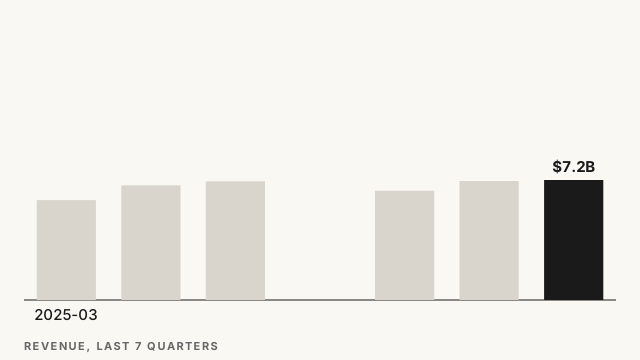
| Revenue | $7.16 billion |
| Net income (GAAP) | $2.49 billion |
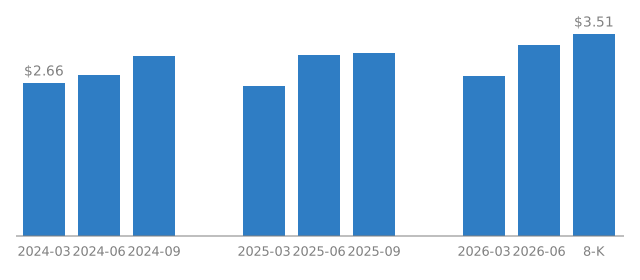
| Diluted EPS (GAAP) | $3.51 |
Results
Revenue was $7,157 million for the quarter ended September 30, 2026, against $7,078 million in the prior-year quarter. Year-to-date revenue was $20,773 million, compared with $19,876 million a year earlier.
Net income was $2,486 million, up from $2,278 million a year ago.
GAAP diluted earnings per share were $3.51, compared with $3.18 in the same quarter last year.
What else stood out
Global Systemwide sales rose 4% to more than $38 billion for the quarter. Consolidated operating income increased 7%, also 7% in constant currencies.
Systemwide sales to loyalty members reached more than $11 billion for the quarter and $41 billion over the trailing twelve months across 70 loyalty markets.
The company declared a 4% increase in its quarterly cash dividend to $1.93 per share.
The quarterly figures extend a rising run: revenue moved from $6,517 million in the March 2026 quarter to $7,099 million in June 2026 and $7,157 million now. GAAP diluted EPS went from $2.78 to $3.32 to $3.51 over the same three quarters, and net income from $1,983 million to $2,362 million to $2,486 million.