Berkshire Hathaway (BRK.B) · Fiscal Q3 2026 · Form 8-K filed Nov 9, 2026
| Key figure | This quarter |
|---|---|
| Net income (GAAP) | $22.11 billion |
| Diluted EPS (GAAP) | $10.33 |
Results
Net earnings attributable to Berkshire shareholders were $22.1 billion in the third quarter of 2026. GAAP earnings per average equivalent Class B share were $10.33.
For the first nine months, net earnings were $57.9 billion, or $26.92 per Class B share (GAAP).
The third quarter of 2025 was higher, at $30.8 billion, or $14.28 per Class B share (GAAP). The nine-month figures were lower a year ago, at $47.8 billion and $22.14 per share.
The company's adjusted (non-GAAP) EPS is not part of this summary. All per-share figures here are GAAP.
What else stood out
Buybacks. Berkshire bought about $9.6 billion of its own treasury shares in the third quarter. The nine-month total is about $14.4 billion, so most of the year's buying came in this quarter.
Insurance float. Float is the money the company holds from insurance contracts before claims are paid. It was about $178.5 billion at September 30, 2026. That is up about $2.1 billion since the end of 2025.
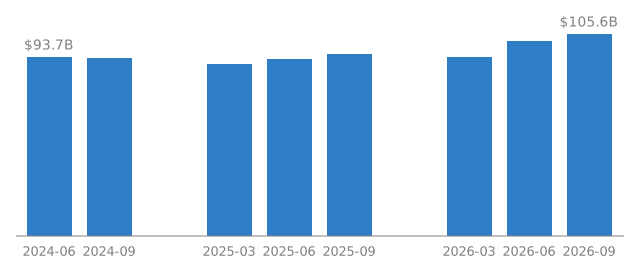
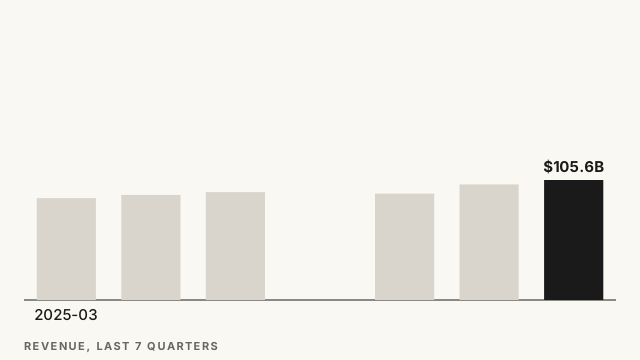
Trend. Quarterly GAAP revenue from the filings was $105.6 billion for the quarter ended September 30, 2026. It was $101.8 billion in the June quarter and $93.7 billion in the March quarter. Net income moved around more: $10.1 billion in March, $25.7 billion in June and $22.1 billion in September.