
Applied Materials (AMAT) · Fiscal Q4 2026 · Form 8-K filed Nov 12, 2026
Shares: +1.0% after hours (as of 4:06 PM ET)
| Key figure | This quarter |
|---|---|
| Revenue | $10.41 billion |
| Net income (GAAP) | $2.72 billion |
| Diluted EPS (GAAP) | $3.40 |
| Diluted EPS (non-GAAP) | $4.16 |
| Gross margin | 50.4% |
| Operating margin (GAAP) | 35.1% |
| Operating cash flow | $3.3 billion |
| Free cash flow (non-GAAP) | $2.62 billion |
Results
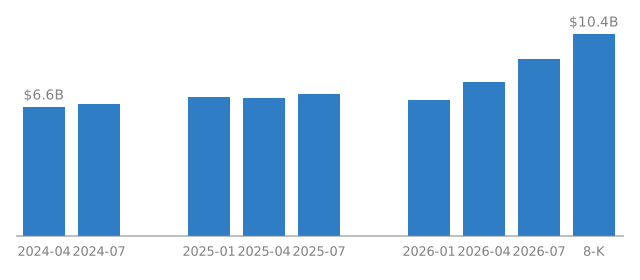
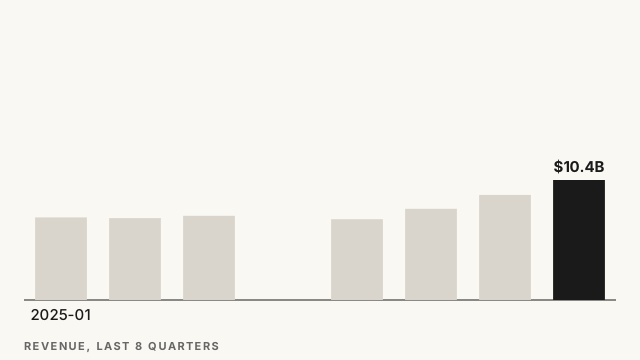
Revenue for the fourth quarter of fiscal 2026 was $10.409 billion. The release shows it up 53% from a year earlier.
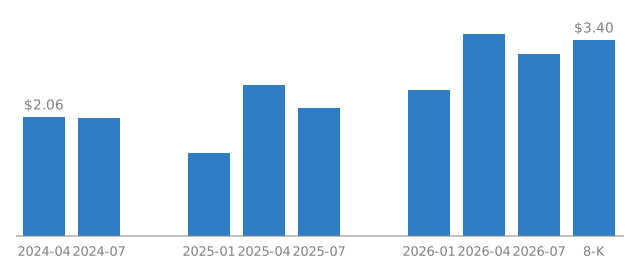
Net income was $2.718 billion, up 43%. GAAP diluted EPS was $3.40, compared with $2.38 a year earlier.
Non-GAAP diluted EPS was $4.16, compared with $2.17 a year earlier. This is the company's adjusted figure.
For the full fiscal year, revenue was $34.446 billion and GAAP EPS was $12.62.
Margins and cash flow
Gross margin was 50.4%, up from 48.0% a year earlier. Operating margin was 35.1%, up from 25.2%.
Operating cash flow was $3.3 billion. Non-GAAP free cash flow was $2.616 billion, up from $2.043 billion a year earlier.
Guidance
For the first quarter of fiscal 2027, Applied expects non-GAAP diluted EPS of $4.35, plus or minus $0.20.
What else stood out
Applied returned $2.42 billion to shareholders in the quarter. That was $2.00 billion of share buybacks and $421 million of dividends.
Revenue has climbed for three straight quarters, from $7.012 billion in the quarter ended January 2026 to $7.910 billion in April and $9.115 billion in July. This quarter's $10.409 billion continues that climb.
Shares were up 1.0% in after-hours trading following the report.