
American International Group (AIG) · Fiscal Q3 2026 · Form 8-K filed Nov 3, 2026
| Key figure | This quarter |
|---|---|
| Net income (GAAP) | $844 million |
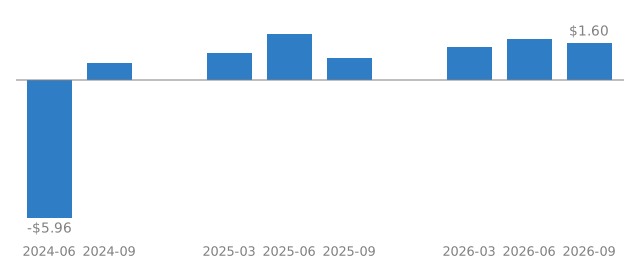
| Diluted EPS (GAAP) | $1.60 |
| Diluted EPS (non-GAAP) | $2.06 |
Results
Net income attributable to AIG common shareholders was $844 million for the third quarter ended September 30, 2026.
GAAP net income per diluted share was $1.60. On the company's adjusted, non-GAAP basis, after-tax income per diluted share was $2.06.
The prior-year quarter, as shown in the same release, had net income of $519 million and GAAP diluted EPS of $0.93, with adjusted after-tax diluted EPS of $2.20.
What else stood out
General Insurance net premiums written were $6.7 billion, up 7% year-over-year on a reported basis and 8% on a constant dollar basis.
The General Insurance combined ratio was 91.3%, and the accident year combined ratio, ex-CAT, was 88.4%.
AIG returned $787 million of capital to shareholders: $527 million of share repurchases and $260 million of dividends.
On November 3, 2026, the board declared a quarterly cash dividend on AIG common stock of $0.50 per share.
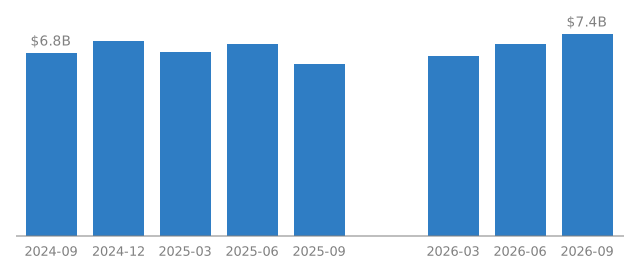
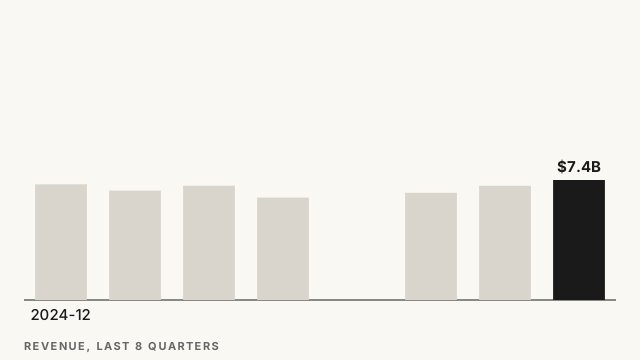
In the GAAP history, revenue was $7.4 billion in the quarter ended September 30, 2026, compared with $6.4 billion a year earlier. Diluted EPS was $1.60, versus $0.93 a year earlier and $1.78 in the prior quarter.